Evaluation of bioinformatic practices for environmental DNA metabarcoding of intertidal algal communities.
Evaluación de prácticas bioinformáticas para códigos de barras de ADN ambiental de comunidades de algas intermareales.
Sergei Bombin y Juan Manuel Lopez-Bautista*
Department of Biological Sciences. The University of Alabama, 500 Hackberry Lane, Mary Harmon Bryant Hall #309 Tuscaloosa, AL 35487-0345
Corresponding author: email: jlopez@ua.edu
Bombin, S. & J.M. Lopez-Bautista. 2020. Evaluation of bioinformatic practices for environmental DNA metabarcoding of intertidal algal communities. Alabama. Cymbella 6(3): 130-138.
Abstract
Environmental DNA (eDNA) metabarcoding is a recent technology that allows for a more effective and cost-efficient evaluation of biotic communities. However, as with all new methodologies, eDNA metabarcoding is under continuous development and improvement. In this study, we evaluated bioinformatics approaches for processing eDNA sequencing data to investigate intertidal algal communities’ biodiversity. We also assessed methodologies for dealing with problematic amplicons data and provided suggestions on using such data in biodiversity studies. Overall, this study showed that paired-reads without overlap could be joined with “N” s or processed as the single-end reads without disrupting correct beta diversity clustering. Evaluated amplicon clustering and reads abundance scaling methods also did not significantly affect beta diversity results. The most vulnerable step appeared to be the taxonomic assignment of clustered amplicons. The presence of “N” in the middle of joined reads dramatically reduces taxonomic assignment effectiveness. Also, k-mer based taxonomy assignment tools tend to assign lower taxonomic ranks to shorter amplicons.
Resumen
Metabarcoding del DNA Ambiental (eDNA) es una tecnología reciente que permite una evaluación más efectiva y eficiente en costo de las comunidades bióticas. Sin embargo, como en todas las metodologías nuevas, el metabarcoding eDNA está en continuo desarrollo y mejoramiento. En este estudio, evaluamos los enfoques bioinformáticos para el procesamiento de datos de secuencia de eDNA para investigar la biodiversidad de las comunidades algales intermareales. También evaluamos las metodologías que tratan con datos de amplicones problemáticos y proveemos sugerencias para utilizar dichos datos en estudios de biodiversidad. En general, este estudio demuestra que pares de lecturas sin traslapamiento podrían ser unidas con “N” s, o procesadas como lecturas de un solo extremo sin perturbar el agrupamiento correcto de la diversidad beta. La evaluación del agrupamiento de amplicones y los métodos escalados de abundancia de lecturas tampoco afectaron significativamente los resultados de diversidad beta. El paso más vulnerable parecer ser la asignación taxonómica de los amplicones agrupados. La presencia de “N” en medio de las lecturas unidas reduce dramáticamente la efectividad de las asignaciones taxonómicas. También, las herramientas de asignación taxonómica basada en los k-meros tienden a asignar rangos taxonómicos menores a amplicones cortos.
INTRODUCTION.
High-throughput sequencing (HTS) has extended DNA-based species identification by providing the opportunity to sequence and identify multiple taxa from the same environment (Ji et al. 2013). The method of environmental DNA (eDNA) sequencing and identification of many distinct species from a common environment is known as metabarcoding. The declining cost of sequencing allows a wide use of metabarcoding for biodiversity surveillance and monitoring.
Like many innovative techniques, metabarcoding has several potential pitfalls which could affect the accuracy of biodiversity estimation. These include PCR-generated errors, sequencing errors, and errors due to partial DNA degradation (Cristescu 2014, Coissac et al. 2012). Formation of chimeric molecules—the primary PCR-generated error—could cause chimeric reads to compose approximately 30% of all amplified sequences (Wang & Wang 1997, Edgar et al. 2011, Smyth et al. 2010). Chimeric reads are caused by the annealing of an incomplete DNA strand to the template of a different DNA sequence. These incomplete strands then act as primers and can be extended to form artificial chimeric reads (Smyth et al. 2010, Edgar et al. 2011). Another set of less common mechanisms of chimeric read formation includes stochastic dissociation of the polymerase, secondary structure induced pausing and dissociation, and nucleotide mis-incorporation (Smyth et al. 2010). Chimeric reads are difficult to identify from the pooled eDNA sequences due to a low confidence in the initial sequence structure. Chimeric sequence bias could be reduced by removing rare amplicons during downstream OTU read clustering (Lammers et al. 2014, de Boer et al. 2015). In recent years, several algorithms have been developed and incorporated into bioinformatics packages to identify chimeric sequences. The most common chimeric read finding software include: UCHIME, ChimeraSlayer, DECIPHER, and CATCh (Edgar et al. 2011, Haas et al. 2011, Wright et al. 2012, Mysara et al. 2015).
Sequencing errors remain one of the major problems in such studies (Coissac et al. 2012). Sequencing errors could cause a two-fold exaggeration of an actual biodiversity estimate (Kunin et al. 2010). Such overestimation could be crucial if these results were to be used for creating or maintaining environmental management policies. Repetitive sequences such as homopolymers and sequencing duplicates are some of the most influential sequencing artifacts, especially if they occur in high-quality regions (Coissac et al. 2012, Balzer et al. 2013). Such reads cannot be removed by quality filtering and are difficult to align to one specific region. Also, the high abundance of the same sequences could mask important rare reads. Several studies demonstrated that up to 50 % of OTUs could be represented by few or single sequences, which could be falsely removed as sequencing artifacts due to their low representation (Agogue et al. 2011, Gilbert et al. 2009, Reeder & Knight 2010).
Overall, the standard bioinformatics pipelines for metabarcoding analyses are still in a developmental stage, especially for non-bacterial communities. Most of these pipelines are developed and used for very specific purposes, which creates an enormous number of tools that were used only one or two times (Cristescu 2014, McPherson 2009, Ratnasingham & Hebert 2013, Bik et al. 2012). Also, it raises the question of which data processing steps are crucial for accurate and efficient analyses of metabarcoding data. The major goals of this publication are to present an assessment of multiple bioinformatics approaches for processing eDNA sequencing data and to provide troubleshooting options for amplicons data with imperfections that could limit an efficiency of default bioinformatics approaches. The methodology was tested on UPA and LSU eDNA sequences collected from the coastal area of the northern Gulf of Mexico (NGoM) with the particular interest for the algal communities.
Methods.
The dataset (Bombin et al. 2020) for this study included paired-end DNA sequences of Universal plastid amplicon (UPA), from the 23S rDNA (primers p23SrV_f1 and p23SrV_r1, 410-450 bp amplicons) (Sherwood & Presting 2007) and part of a large nuclear ribosomal subunit (LSU rDNA) (primers C1FL and D1FL, 550-590 bp amplicons) (Leliaert et al. 2007). The Illumina libraries for both amplicons were prepared with 2x250 basepair (bp) paired-end chemistry and the second time with 2x300 bp paired-end chemistry, MiSeq Reagents kits v2 and v3 respectively (MS-102-2003 and MS-102-3003) and sequenced on Illumina MiSeq platform at the Genomics and Sequencing Center at the University of Rhode Island. Environmental DNA samples were collected from intertidal and water column zones of Cape San Blass (CSB), FL, USA and Grand Isle (GIS), LA, USA.
Demultiplexed reads were processed with Trimmomatic-0.36 (Bolger et al. 2014) with the default options. Trimmomatic-0.36 checked a correct elimination of standard Illumina-specific barcode sequences discarding leading and trailing low-quality bases, and completely removed all sequences shorter than 36 bases. Forward and reverse reads were merged and assembled by USEARCH -fastq_mergepairs tool (Edgar 2010). Merged reads and sequences that did not have a merging pair were filtered with -fastq_filter command, discarding all reads with an expected error greater than one. Reads were dereplicated and unique sequences were counted with VSEARCH --derep_fulllength command (Rognes et al. 2016) removing reads shorter than 50, 75, and 150 bp for comparisons. Singletons and chimeric reads were removed, and reads were clustered into operational taxonomic units (OTUs) with 97 % identity or zero-radius OTU (ZOTU) with 100 % identity using -cluster_otus or -unoise3 tools, respectively. OTUs were assigned to the lowest possible taxonomic rank by the UCLUT algorithm implemented in QIIME 1.9.1 (Caporaso et al. 2010, Edgar 2010) and by the SINTAX tool (Edgar 2016) implemented in VSEARCH (Rognes et al. 2016). The custom-designed sequence database, which included Sherwood’s Lab database (Sherwood et al. 2017) and published reference sequences of seaweeds and phytoplankton, was used as the reference for taxonomy assignment. The database was filtered to include only taxonomic groups that belong to: Rhodophyta, Bacillariophyta, Cercozoa, Charophyceae, Chlora-
rachniophyceae, Chlorokybophyceae, Chlorophyta, Chrysophyceae, Ciliophora, Coleochaetales, Coleochaetophyceae, Cryptophyta, Cyanobacteria, Dictyochophyceae, Dinophyceae, Euglenida, Eustigmatophyceae, Haptophyceae, Klebsormidiophyceae, Mesostigmatophyceae, Mesotaeniaceae, Oomycetes, Pelagophyceae Phaeophyceae, Phaeothamniophyceae, Raphidophyceae, Xanthophyceae, and Zygnematophyceae.
Reads cumulative sum scaling (CSS) normalization and/or rarefaction for alpha and beta diversities were performed through QIIME 1.9.1 with metagenomeSeq 1.26.1(Paulson et al. 2013). Rarefaction was performed with depths of 1, 10, 200 and 300 thousand(s) reads. UPA and LSU sequences were aligned separately with MUSCLE 3.8 (Edgar 2004) with the default options. Alignments were filtered by QIIME’s filter_alignment.py script and OTUs/ZOTUs neighbor-joining trees were inferred by MUSCLE 3.8. Binary Jaccard (Jaccard 1912), Bray Curtis (Faith et al. 1987), and Weighted UniFrac distance and principal coordinates (PCoA) analysis matrices were calculated by beta_diversity_through_plots.py script with R 3.6.1 and Vegan v2.4-2 package.
Results and Discussion.
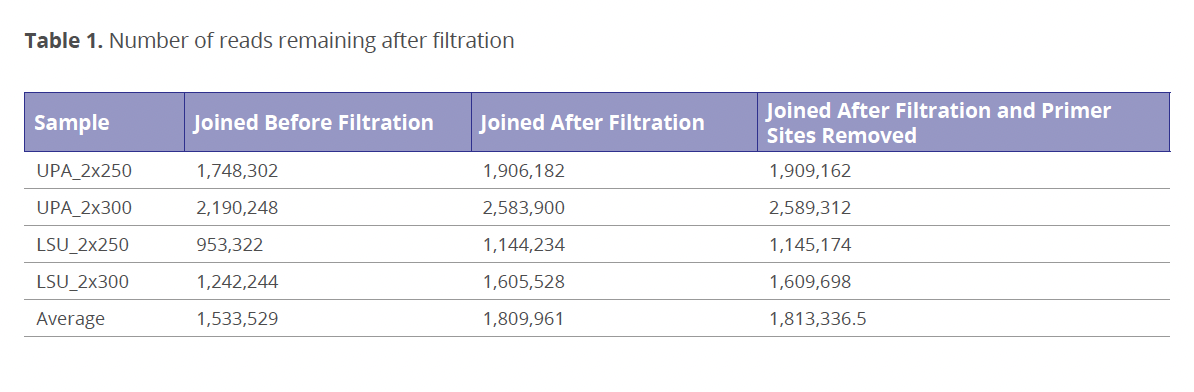
Processing of Unmerged Paired-end Reads: Up to 99 % of LSU and 68 % of UPA paired reads did not merge due to lack of overlap between forward and reverse sequences (Bombin et al. 2020). Therefore, two strategies for the processing such sequences were compared: 1) treating unmerged paired reads as single-end reads (Lanner et al. 2019) and 2) joining forward and reverse reads with a region of the ambiguous bases (N) (Eckert et al. 2018). The chosen method for processing unmerged reads had a strong impact on the number of reads that pass quality filtration. The unmerged reads that were processed as the single-end reads generally passed USEARCH quality filtration step with the same rate of ~98.2 % as the merged reads. However, 15.27 % more reads were discarded by the USEARCH filtering algorithm if the same reads were joined beforehand (Table 1), even when the highest Phred quality score was assigned to joining bases (N). USEARCH v.11 documentation and other literature search did not provide any explanation for this behavior of the filtration algorithm. Therefore, the best solution was to join reads after they passed the quality filtration step. Also, removal of primer binding sites, which is suggested by creator of USEARCH R. Edgar (https://drive5.com/usearch/manual/pipe_readprep_primers.html) in order to decrease an expected error value of reads, was evaluated as well. Stripping primers binding sites just slightly increased the number of reads that pass the filtration step (Table 1). However, this increase was almost completely cancelled out when reads were filtered to the minimum length of 150 bp.
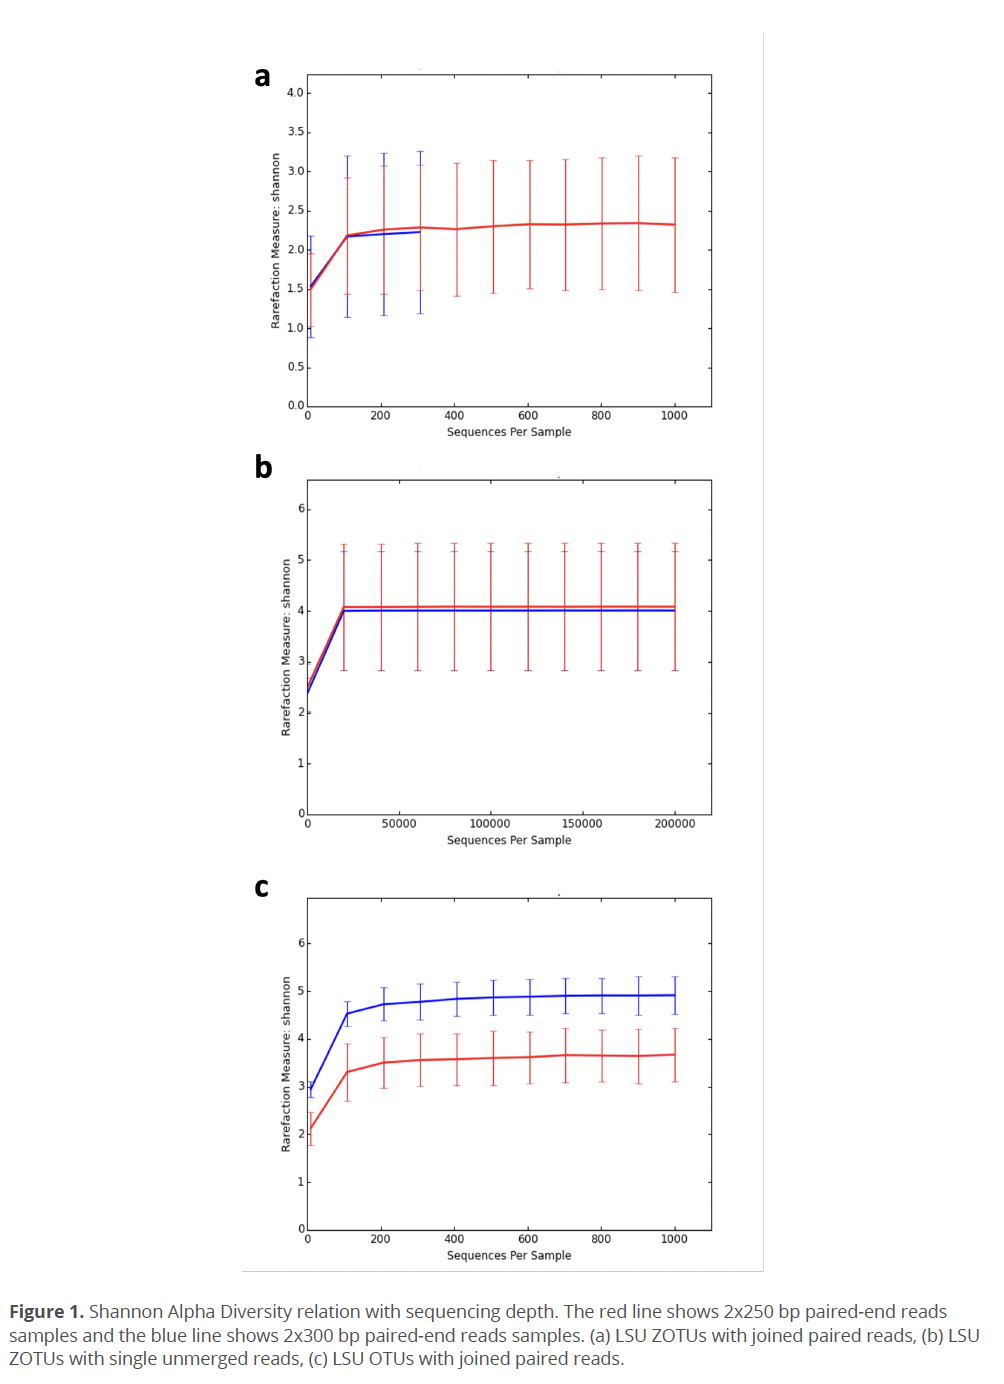
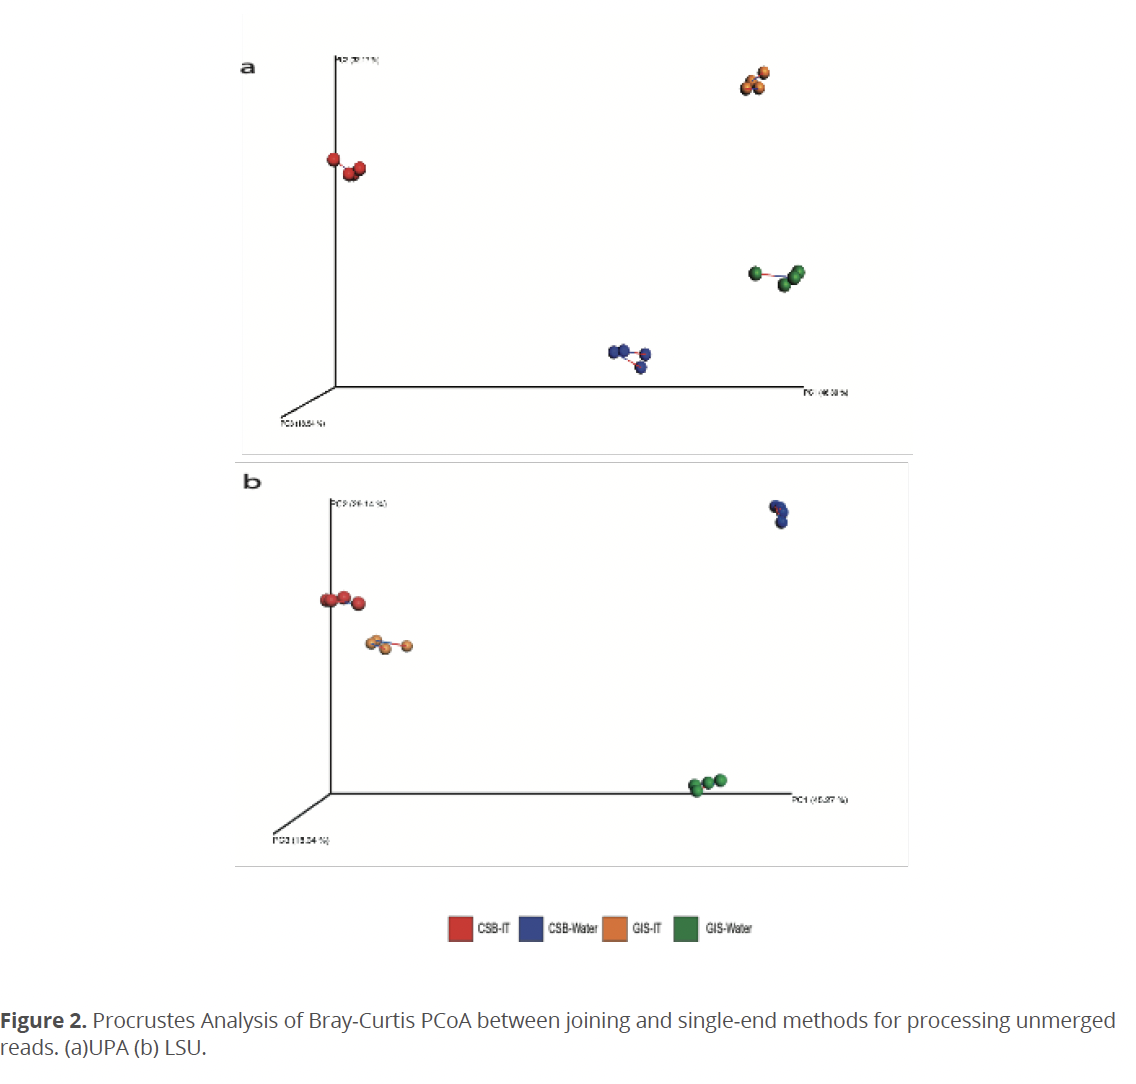
OTUs/ZOTUs resulting from any joining method had at least two-fold lower ratio of reads that were able to map back to OTU/ZOTU sequences, which is a required step for calculating a relative abundance. Therefore, OTU/ZOTU abundance tables showed lower fraction of non-zero values, which could decrease effectiveness of statistical comparison and diversity estimates between environmental samples (Kaul et al. 2017, Weiss et al. 2017). Also, lower number of mapped reads decreased the possible rarefaction depth. This was especially noticeable for LSU’s ZOTU with joined reads (Fig. 1a), which showed the lowest (among tested methods) average sequence per sample count of 16,908.3 (Median: 15,697). When unmerged reads form the same samples were processed as single-end reads, the average sequence per sample count reached 317,614.4 (Median: 318,474.5), which increased the possible rarefaction depth (Fig. 2b). A low subsampling rarefaction depth leads to an overall decrease in diversity (Weiss et al. 2017) and raises the impact of random chance (McMurdie & Holmes 2014). However, Procrustes analysis showed that there is no statistically significant difference between sample diversity (beta diversity) caused by unmerged reads processing method. These results indicate that reads loss, which occurred on the mapping stage due to the reads joining method, was even (or almost even) between all environmental samples.
Data Transformations for Diversity Metrics: In the current study we also evaluated effects of reads clustering methods (OTUs and ZOTUs), minimum length of sequences for the analysis, and the relative abundance data transformation techniques including rarefaction and scaling normalization on alpha- and beta- diversity results. Overall, the OTUs approach was more tolerant to the unmerged reads joining method and had more mapped reads in all environmental samples. Also, the utilization of the OTUs instead of ZOTUs relative abundance table increased an average alpha diversity and decreased a standard deviation value (Fig. 1c).
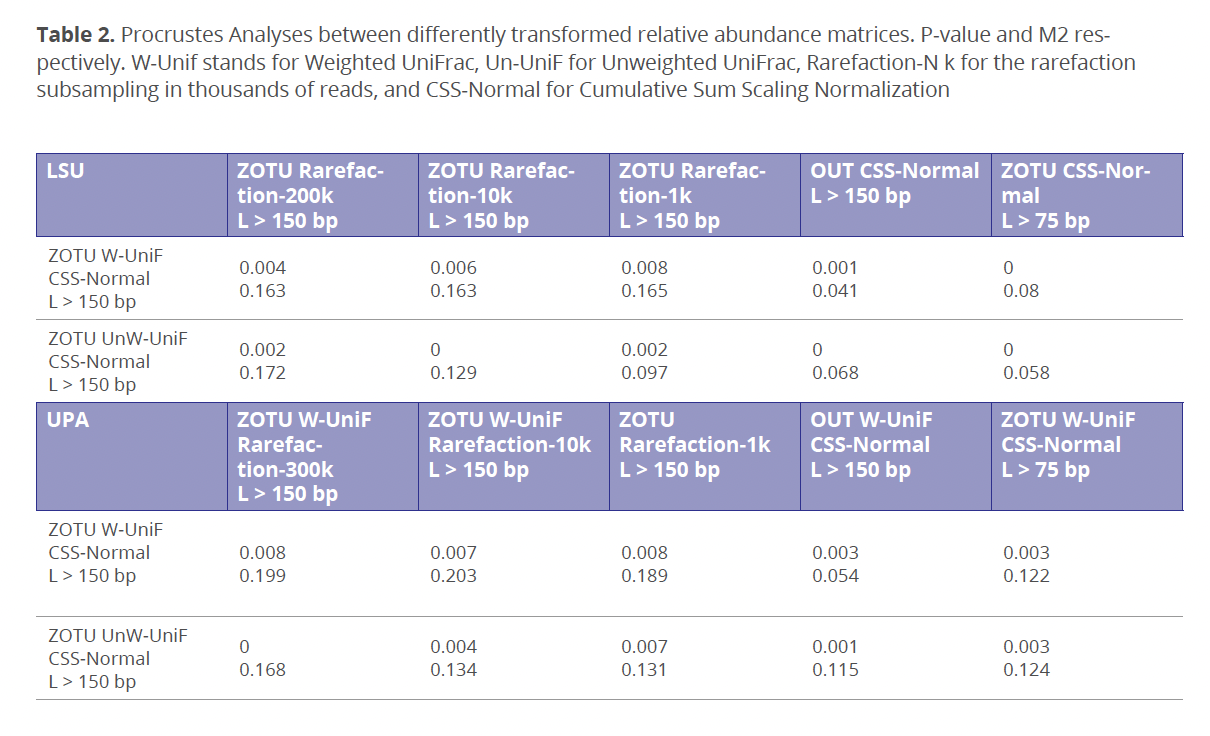
HTS data cannot be used to estimate and compare diversity metrices immediately because in most cases, the abundance of sequenced reads is not proportional to the abundance of organisms in the sampled environment. Such absence in the meaningful correlation between the reads and organisms’ frequencies is often referred as the “abundance bias,” which is caused by unequal DNA-template preferability during PCR and sequencing procedures. Currently, there is no universal methodology to correct abundance bias in metabarcoding data, but the most widely used data transformation methods include rarefaction and scaling normalization (Weiss et al. 2017). Rarefaction is dependent on the sequencing depth of a sample with the lowest reads count, which could cause diversity loss and increased chance of type 1 and type 2 errors when samples are sequences with unequally (McMurdie & Holmes 2014). On the other hand, accuracy of the scaling normalization can be greatly affected by zero values and rare OUT/ZOTU presence in samples with variability of the sequencing depth (Weiss et al. 2017). Unexpectedly, the multiple Procrustes analysis indicated that the tested data transformation method or any other reads processing modification did not have a statistically significant impact (p-values ≤ 0.5) on the beta diversity results (Table 2). These results can be due to rather high sequencing depth of all environmental samples and/or relatively limited number of tested environmental samples in our dataset.
Taxonomic Assignments: Stripping the primer binding sites only decreased the average amplicon length and taxonomic resolution (i.e., ability to recover low ranks such as genus and species) and had no effect on diversity. Lower taxonomic resolution of primer binding sites free reads was caused due to a reduction of nucleotides available for alignment against the reference database and loss of taxonomic signal. A similar pattern was also reported by Pauvert et al. (2019), who showed that splicing ITS1F-ITS2 primer sequences did not enhance a reconstruction of mock community structure. Removal of primers that do not contain degenerate nucleotides is unnecessary, because non-degenerate primers do not affect the denoising clustering (Pauvert et al. 2019). Joined reads worked poorly for the LSU marker, which was due to the actual large gap size between forward and reverse reads. Also, the current data demonstrates that SINTAX and several other k-mer based taxonomy assignment tools tend to assign lower taxonomic ranks to shorter amplicons, which highlights the importance of an accurately composed and filtrated reference databases to prevent a false positive, by chance matches.
In the current work we evaluated strategies for the processing of unmerged paired reads and reads filtering thresholds and their effect on produced amplicons, diversity results, and taxonomic assignments. Overall, saving high-quality unmerged reads does not disrupt samples clustering according to their collection origin (i.e., sample 1 and sample 2 of CSB intertidal) and unmerged paired-reads could provide further comparative information about algal communities according to their respective biological zonation. Also, as it is shown in this study, the processing of unmerged reads and/or data transformation methods should not have a significant impact on the diversity estimates if the samples are sequenced with enough depth. However, it should be noticed that the k-mer based taxonomic assignment methods could be sensitive to the choice of reads processing methodology, which could affect species richness estimates.
REFERENCIAS
Agogue, H., D. Lamy, P.R. Neal, M.L. Sogin, & G.J.Herndl. 2011. Water mass-specificity of bacterial communities in the North Atlantic revealed by massively parallel sequencing. Molecular Ecology 20: 258-274.
Balzer, S., K. Malde, M.A. Grohme & I. Jonassen. 2013. Filtering duplicate reads from 454 pyrosequencing data. Bioinformatics 29: 830-836.
Bik, H. M., D.L. Porazinska, S. Creer, J.G. Caporaso, R. Knight & W.K. Thomas. 2012. Sequencing our way towards understanding global eukaryotic biodiversity. Trends in Ecology and Evolution 27: 233-243.
Bolger, A.M., M. Lohse & B. Usadel. 2014. Trimmomatic: a flexible trimmer for Illumina sequence data. Bioinformatics 30: 2114-2120.
Bombin, S., B. Wysor & J.M. Lopez-Bautista. 2020. Assessment of littoral algal diversity from the northern Gulf of Mexico using environmental DNA metabarcoding. Journal of Phycology 57: 269-278
Caporaso, J. G., J. Kuczynski, J. Stombaugh, K. Bittinger, F.D. Bushman, E.K. Costello, N. Fierer, A.G. Pena, J.K. Goodrich, J.I. Gordon, G.A. Huttley, S.T. Kelley, D. Knights, J.E. Koenig, R.E. Ley, C.A. Lozupone, D. McDonald, B.D. Muegge, M. Pirrung, J. Reeder, J.R. Sevinsky, P.J. Turnbaugh, W.A. Walters, J. Widmann, T. Yatsunenko, J. Zaneveld & R. Knight. 2010. QIIME allows analysis of high-throughput community sequencing data. Nature methods 7: 335.
Coissac, E., T. Riaz & N. Puillandre. 2012. Bioinformatic challenges for DNA metabarcoding of plants and animals. Molecular Ecology 21: 1834-47.
Cristescu, M. E. 2014. From barcoding single individuals to metabarcoding biological communities: towards an integrative approach to the study of global biodiversity. Trends in Ecology and Evolution 29: 566-571.
de Boer, H. J., M.C. Ichim & S.G. Newmaster. 2015. DNA Barcoding and Pharmacovigilance of Herbal Medicines. Drug Safety 38: 611-620.
Eckert, I.M., J.E. Littlefair, G.K. Zhang, F.J. Chain, T.J. Crease & M.E. Cristescu. 2018. Bioinformatics for biomonitoring: Species detection and diversity estimates across Next-Generation Sequencing Platforms. Advances in Ecological Research 59: 1-32.
Edgar, R. 2016. SINTAX: a simple non-Bayesian taxonomy classifier for 16S and ITS sequences. BioRxiv:074161.
Edgar, R.C. 2004. MUSCLE: multiple sequence alignment with high accuracy and high throughput. Nucleic acids research 32: 1792-1797.
Edgar, R.C. 2010. Search and clustering orders of magnitude faster than BLAST. Bioinformatics 26: 2460-2461.
Edgar, R.C., B.J. Haas, J.C. Clemente, C. Quince & R. Knight. 2011. UCHIME improves sensitivity and speed of chimera detection. Bioinformatics 27: 2194-2200.
Faith, D. P., P.R. Minchin & L. Belbin. 1987. Compositional Dissimilarity as a Robust Measure of Ecological Distance. Vegetatio 69: 57-68.
Gilbert, J.A., D. Field, P. Swift, L. Newbold, A. Oliver, T. Smyth, P.J. Somerfield, S. Huse & I. Joint. 2009. The seasonal structure of microbial communities in the Western English Channel. Environmental Microbiology 11: 3132-3139.
Haas, B.J., D. Gevers, A. Earl, M. Feldgarden, D.V. Ward, G. Giannoukos, D. Ciulla, D. Tabbaa, S.K. Highlander, E. Sodergren, B. Methé, T.Z. DeSantis, Human Microbiome Consortium, J.F. Petrosino, R. Knight & B.W. Birren. 2011. Chimeric 16S rRNA sequence formation and detection in Sanger and 454-pyrosequenced PCR amplicons. Genome Research 21: 494-504.
Jaccard, P. 1912. The distribution of the flora in the alpine zone. 1. New phytologist 11: 37-50.
Ji, Y., L. Ashton, S.M. Pedley, D.P. Edwards, Y. Tang, A. Nakamura, R. Kitching, P.M. Dolman, P. Woodcock, F.A. Edwards, T.H. Larsen,W.W. Hsu, S. Benedick, K.C. Hamer, D.S. Wilcove, C. Bruce, X. Wang, T. Levi, M. Lott, B. C. Emerson & D.W. Yu. 2013. Reliable, verifiable and efficient monitoring of biodiversity via metabarcoding. Ecology Letters 16: 1245-1257.
Kaul, A., S. Mandal, O. Davidov & S.D. Peddada. 2017. Analysis of microbiome data in the presence of excess zeros. Frontiers in Microbiology 8: 2114.
Kunin, V., A. Engelbrektson, H. Ochman & P. Hugenholtz. 2010. Wrinkles in the rare biosphere: pyrosequencing errors can lead to artificial inflation of diversity estimates. Environmental Microbiology 12: 118-123.
Lammers, Y., T. Peelen, R.A. Vos & B. Gravendeel. 2014. The HTS barcode checker pipeline, a tool for automated detection of illegally traded species from high-throughput sequencing data. BMC Bioinformatics 15: 44.
Lanner, J., M. Curto, B. Pachinger, U. Neumüller & H. Meimberg. 2019. Illumina midi-barcodes: quality proof and applications. Mitochondrial Dna Part A 30: 490-499.
Leliaert, F., O. De Clerck, H. Verbruggen, C. Boedeker & E. Coppejans. 2007. Molecular phylogeny of the Siphonocladales (Chlorophyta: Cladophorophyceae). Molecular phylogenetics and evolution 44: 1237-1256.
McMurdie, P.J. & S. Holmes. 2014. Waste not, want not: why rarefying microbiome data is inadmissible. PLoS Computational Biology 10:e1003531.
McPherson, J.D. 2009. Next-generation gap. Nature Methods 6: S2-5.
Mysara, M., Y. Saeys, N. Leys, J. Raes & P. Monsieurs. 2015. CATCh, an ensemble classifier for chimera detection in 16S rRNA sequencing studies. Applied Environmental Microbiology 81: 1573-1584.
Paulson, J.N., O.C. Stine, H.C. Bravo & M. Pop. 2013. Differential abundance analysis for microbial marker-gene surveys. Nature methods 10: 1200.
Pauvert, C., M. Buée, V. Laval, V. Edel-Hermann, L. Fauchery, A. Gautier, I. Lesur, J. Vallance & C. Vacher. 2019. Bioinformatics matters: the accuracy of plant and soil fungal community data is highly dependent on the metabarcoding pipeline. Fungal Ecology 41: 23-33.
Ratnasingham, S. & P.D. Hebert. 2013. A DNA-based registry for all animal species: the barcode index number (BIN) system. PLoS One 8: e66213.
Reeder, J. & R. Knight. 2010. Rapidly denoising pyrosequencing amplicon reads by exploiting rank-abundance distributions. Nature Methods 7: 668-669.
Rognes, T., T. Flouri, B. Nichols, C. Quince & F. Mahé. 2016. VSEARCH: a versatile open source tool for metagenomics. PeerJ 4: e2584.
Sherwood, A.R., M.N. Dittbern, E.T. Johnston & K.Y. Conklin. 2017. A metabarcoding comparison of windward and leeward airborne algal diversity across the Ko’olau mountain range on the island of O’ahu, Hawai’i (1). Journal of Phycology 53: 437-445.
Sherwood, A.R. & G.G. Presting. 2007. Universal primers amplify a 23s rDNA plastid marker in eukaryotic algae and cyanobacteria 1. Journal of Phycology 43: 605-608.
Smyth, R. P., T.E. Schlub, A. Grimm, V. Venturi, A. Chopra, S. Mallal, M.P. Davenport & J. Mak. 2010. Reducing chimera formation during PCR amplification to ensure accurate genotyping. Gene 469: 45-51.
Wang, G. C. & Y. Wang. 1997. Frequency of formation of chimeric molecules as a consequence of PCR coamplification of 16S rRNA genes from mixed bacterial genomes. Applied and Environmental Microbiology 63: 4645-4650.
Weiss, S., Z. Xu, S. Peddada, A. Amir, K. Bittinger, A. Gonzalez, C. Lozupone, J.R. Zaneveld, Y. Vázquez-Baeza & A. Birmingham. 2017. Normalization and microbial differential abundance strategies depend upon data characteristics. Microbiome 5: 27.
Wright, E.S., L.S. Yilmaz & D.R. Noguera. 2012. DECIPHER, a search-based approach to chimera identification for 16S rRNA sequences. Applied and Environmental Microbiology 78: 717-725.
Sometido: 3 de diciembre de 2020
Revisado: 5 de marzo de 2021 (Dr. Francisco F. Pedroche y Dr. James T. Melton)
Corregido: 18 de marzo de 2021
Aceptado: 19 de marzo de 2021